Using Analytics to Improve UX dives into the world of data-driven design, uncovering how analyzing user behavior can revolutionize the way we create digital experiences. From understanding key performance indicators to implementing cutting-edge tools, this topic delves into the core of enhancing user experience through analytics.
Understanding UX Analytics

UX analytics plays a crucial role in evaluating user behavior on websites and applications. By analyzing data, businesses can make informed decisions to improve the overall user experience.
Types of Data Collected Through UX Analytics
- User Interaction Data: This includes clicks, scrolls, and navigation patterns that provide insights into how users engage with the interface.
- Conversion Rates: Tracking the number of users who complete desired actions, such as making a purchase or signing up for a newsletter.
- User Feedback: Gathering user opinions and comments through surveys, reviews, and ratings to understand their preferences and pain points.
Key Performance Indicators (KPIs) in UX Analytics
- Conversion Rate: The percentage of users who complete a specific goal, like making a purchase or submitting a form.
- Bounce Rate: The percentage of users who leave a website after viewing only one page, indicating a lack of engagement.
- Average Session Duration: The average amount of time users spend on a website or app, reflecting user interest and engagement levels.
Implementing UX Analytics Tools
When it comes to improving user experience, having the right analytics tools can make all the difference. Let’s dive into comparing popular tools like Google Analytics, Hotjar, and Crazy Egg, and explore how to effectively set them up for UX analysis.
Comparing Popular UX Analytics Tools
- Google Analytics: Known for its comprehensive features and in-depth insights, Google Analytics is a go-to tool for many websites and applications. It provides a wide range of data on user behavior, demographics, and more.
- Hotjar: Hotjar offers heatmaps, session recordings, and user feedback tools to help visualize user interactions with your site. It’s great for understanding how users navigate and engage with your content.
- Crazy Egg: Crazy Egg specializes in heatmaps and A/B testing, allowing you to visually see where users are clicking on your site and test different design elements for optimization.
Setting Up Event Tracking
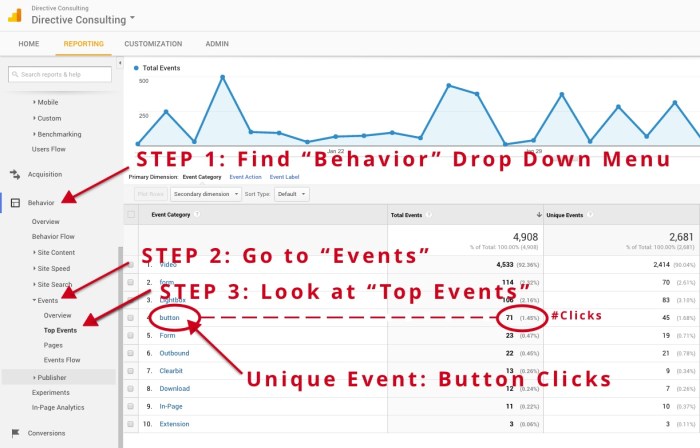
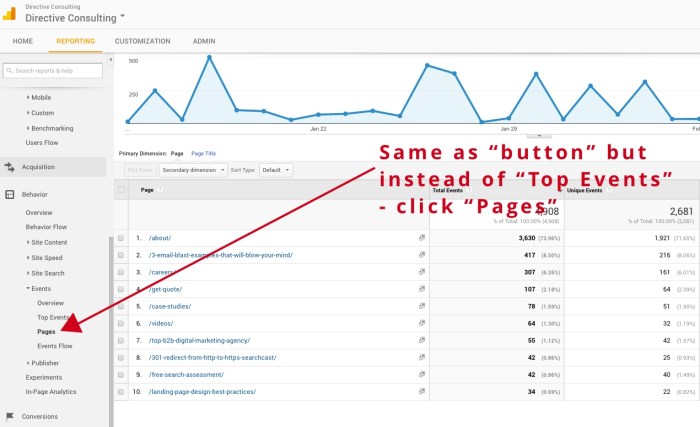
Event tracking is crucial for understanding how users interact with specific elements on your site. Here’s how you can set it up in analytics tools:
- Identify key interactions: Determine which user actions you want to track, such as clicks on buttons, form submissions, or video views.
- Set up tracking codes: Implement event tracking codes provided by your analytics tool on the relevant elements of your website or application.
- Monitor and analyze: Regularly review the event tracking data to gain insights into user behavior and identify areas for improvement.
Integrating UX Analytics Tools
Integrating UX analytics tools seamlessly with your website or application is essential for continuous monitoring and optimization. Here are some best practices to consider:
- Customize tracking settings: Tailor the tracking parameters to align with your specific UX goals and metrics.
- Regularly review reports: Analyze the data regularly to identify trends, patterns, and areas that require attention.
- Collaborate with teams: Share insights and collaborate with design, development, and marketing teams to implement data-driven improvements.
Analyzing User Interaction Data: Using Analytics To Improve UX
When it comes to analyzing user interaction data to improve UX design, it’s all about digging deep into how users interact with your website or app. By examining metrics like click-through rates, bounce rates, time on page, and conversion rates, you can gain valuable insights into what’s working well and what needs improvement. This data-driven approach allows you to make informed decisions to enhance the overall user experience.
Using Heatmaps to Identify User Behavior Patterns
Heatmaps are a powerful tool that visually represent user interaction data. By using heatmaps, you can see where users are clicking, how far they scroll down a page, and which areas are getting the most attention. This information can help you identify user behavior patterns, such as popular sections of a page, areas that are being overlooked, or elements that may be confusing users.
For example, a heatmap may reveal that users are clicking on a non-clickable element, indicating a need for improvement in that area.
Significance of A/B Testing in Optimizing UX
A/B testing is a crucial method in optimizing UX based on analytics insights. By comparing two versions of a webpage or app feature (A and B) to see which performs better, you can make data-driven decisions to improve user experience. For instance, you can test different button colors, placement of elements, or call-to-action text to see which version leads to better user engagement or conversions.
A/B testing allows you to experiment with changes and continuously refine your design based on real user data.
Enhancing User Journey with Analytics

In today’s digital landscape, enhancing the user journey with analytics has become crucial for businesses looking to optimize their user experience. By leveraging insights derived from UX analytics, companies can design a seamless user journey that addresses pain points and personalizes the experience to boost engagement.
Designing a User Journey Map
Creating a user journey map involves visualizing the steps a user takes to interact with a product or service. By analyzing data from UX analytics tools, businesses can identify key touchpoints, pain points, and opportunities for improvement along the user journey. This map serves as a strategic guide for enhancing the overall user experience.
Identifying Pain Points
Analytics plays a vital role in pinpointing pain points in the user journey. By analyzing user behavior, businesses can identify areas where users struggle, encounter friction, or drop off. This data-driven approach allows companies to prioritize and address these pain points, ultimately improving the user experience and increasing conversion rates.
Personalizing User Experience, Using Analytics to Improve UX
Analytics enables businesses to personalize the user experience by understanding individual user preferences and behavior. By segmenting users based on their interactions with the product or service, companies can tailor content, recommendations, and features to meet specific needs. This personalized approach not only enhances user satisfaction but also fosters long-term engagement and loyalty.
