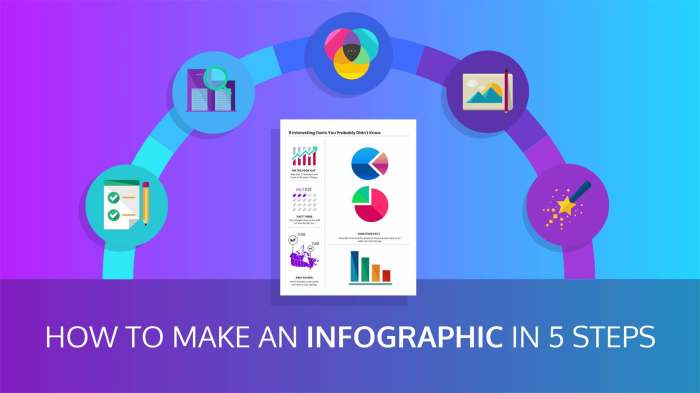
Creating Infographics is all about blending data and design to create visually compelling stories that captivate audiences. Dive into this guide to unleash your creativity and communication skills!
Understanding Infographics
Infographics are visual representations of information, data, or knowledge that are designed to present complex information quickly and clearly. They combine text, images, and graphics to create an engaging and easy-to-understand format for the audience.
Using infographics in communication has several benefits. They are visually appealing, making it easier for the audience to grasp the information presented. Infographics are also more shareable on social media platforms, increasing the reach of the message. Additionally, they can help simplify complex data and statistics, making them more accessible to a wider audience.
Examples of Effective Infographics
Effective infographics can be found across various industries, showcasing the versatility and impact of this visual communication tool. Some examples include:
- An infographic by a healthcare company illustrating the benefits of a healthy lifestyle, with statistics and tips for staying fit.
- A financial services infographic comparing different investment options, highlighting the pros and cons of each in a visually appealing format.
- An educational infographic explaining a complex scientific concept using diagrams and illustrations to aid understanding.
- A technology company’s infographic showcasing the evolution of a product over time, capturing the attention of consumers and highlighting key features.
Types of Infographics
Infographics come in various types, each serving a specific purpose based on the data or information being shared. Let’s explore the different types and when to use them.
Statistical Infographics
Statistical infographics are perfect for presenting complex data in a visually appealing way. These infographics often include charts, graphs, and other visual representations to make data easier to understand. One popular example is the “Global Population Growth” infographic, which uses bar graphs and pie charts to illustrate population trends over the years.
Informational Infographics
Informational infographics are used to educate and inform the audience about a particular topic. These infographics typically include facts, statistics, and key points presented in a visually engaging manner. An example of an informational infographic is “The Benefits of Exercise,” which highlights various health benefits of staying active through a combination of text and icons.
Timeline Infographics, Creating Infographics
Timeline infographics are great for showcasing a sequence of events or milestones in a chronological order. These infographics use a timeline format to visually represent the progression of a story or historical events. A popular example is the “Evolution of Technology,” which maps out the key advancements in technology over time using a linear timeline with images and descriptions.
Process Infographics
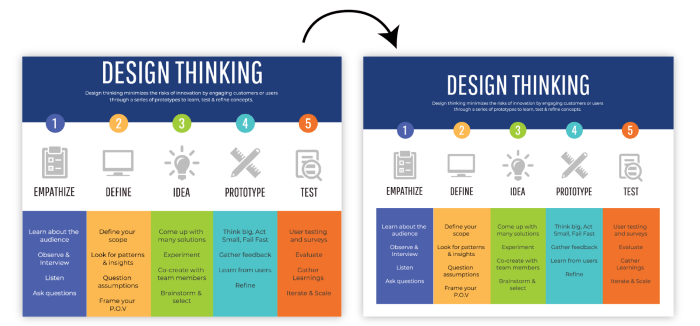
Process infographics are used to explain a step-by-step process or procedure in a clear and concise manner. These infographics often feature a flowchart or numbered list to guide the audience through each stage of the process. An example of a process infographic is “How to Make a Cup of Coffee,” which breaks down the coffee-making process into simple, easy-to-follow steps accompanied by illustrations.
Design Principles
When it comes to creating eye-catching infographics, understanding key design principles is crucial. From color schemes to typography and layout, each element plays a significant role in the overall visual appeal of your infographic.
Color Schemes
Color schemes can make or break an infographic. Choose colors that complement each other and enhance readability. Avoid using too many colors that may overwhelm the viewer. Stick to a cohesive color palette that aligns with your brand or message.
Typography
Typography is another essential aspect of infographic design. Use fonts that are easy to read and appropriate for the content. Experiment with font sizes and styles to create hierarchy and emphasize key points. Remember, consistency is key to maintain a professional look.
Layout
The layout of your infographic should guide the viewer through the information seamlessly. Organize content in a logical flow, ensuring that each section is visually distinct. Balance text and visuals to prevent overcrowding or empty spaces. A well-structured layout enhances the overall user experience.
Data Visualization
When it comes to creating infographics, visualizing data effectively is key to making complex information easy to understand. By presenting data in a visually appealing way, you can capture the attention of your audience and convey your message more clearly.
Tools and Software for Data-Driven Infographics
To create data-driven infographics, there are a variety of tools and software options available that can help you bring your data to life. Some popular tools include:
- Adobe Illustrator: A versatile tool that allows for precise control over design elements.
- Canva: An easy-to-use platform with pre-designed templates for creating infographics.
- Tableau: A powerful data visualization tool that can create interactive infographics.
Creative Data Visualization Examples
When it comes to presenting data visually, there are endless creative possibilities. Here are some examples of unique ways to present data in infographics:
- Use of charts and graphs: Visualizing data with pie charts, bar graphs, or line charts can make complex data more digestible.
- Infographic timelines: Presenting data in a chronological timeline can help viewers understand the progression of information over time.
- Interactive maps: Creating interactive maps with data points can engage users and provide a spatial context to the information.
Content Creation: Creating Infographics

Creating content for infographics involves a series of steps to ensure that the information presented is engaging, informative, and visually appealing. This process includes researching, organizing, and simplifying information, as well as crafting compelling headlines and copy.
Researching Information
Research is the foundation of creating effective infographics. It is essential to gather accurate and reliable information from credible sources to ensure the content is informative and trustworthy. Utilize a variety of sources such as articles, studies, reports, and data sets to support your infographic’s message.
Organizing Information
Once you have gathered the necessary information, it is important to organize it in a logical and coherent manner. Create an Artikel or storyboard to determine the flow of information and how different data points will be presented visually. Organizing information effectively helps in conveying the message clearly to the audience.
Simplifying Information
Infographics are meant to simplify complex information and make it easily digestible for the audience. Focus on highlighting key points and data that are most relevant to the topic. Use visuals, charts, and graphs to present data in a clear and concise manner, avoiding unnecessary details that may overwhelm the viewer.
Crafting Compelling Headlines and Copy
The headline of your infographic is the first thing that grabs the audience’s attention. Craft a compelling and concise headline that clearly conveys the main message of the infographic. When writing copy for the infographic, keep it short, engaging, and to the point. Use a conversational tone to connect with the audience and make the content more relatable.
Distribution and Promotion

When it comes to getting your awesome infographics out there for the world to see, you gotta have a solid game plan for distribution and promotion. It’s all about making sure your content gets in front of the right eyeballs and gets the engagement it deserves. Let’s dive into some strategies to make that happen.
Promoting on Social Media
- Create visually appealing posts: Make sure your social media posts featuring your infographics are eye-catching and engaging to stop the scroll.
- Use relevant hashtags: Help your infographics get discovered by using popular and relevant hashtags on platforms like Instagram and Twitter.
- Tag influencers and brands: Collaborate with influencers in your niche or tag relevant brands to increase the reach of your infographics.
Optimizing for Sharing and Engagement
- Include social sharing buttons: Make it easy for viewers to share your infographics by including social sharing buttons on your website or blog.
- Encourage user-generated content: Ask your audience to share their thoughts or experiences related to your infographics to boost engagement.
- Create interactive infographics: Incorporate interactive elements like quizzes or clickable features to make your infographics more engaging and shareable.
Reaching a Wider Audience
- Guest post on relevant websites: Reach out to websites in your niche and offer to create a guest post featuring your infographics to tap into new audiences.
- Collaborate with other creators: Partner up with other content creators or brands to cross-promote your infographics and reach a wider audience.
- Utilize email marketing: Share your infographics with your email subscribers to keep them engaged and drive traffic back to your website or social media channels.
